Metrics
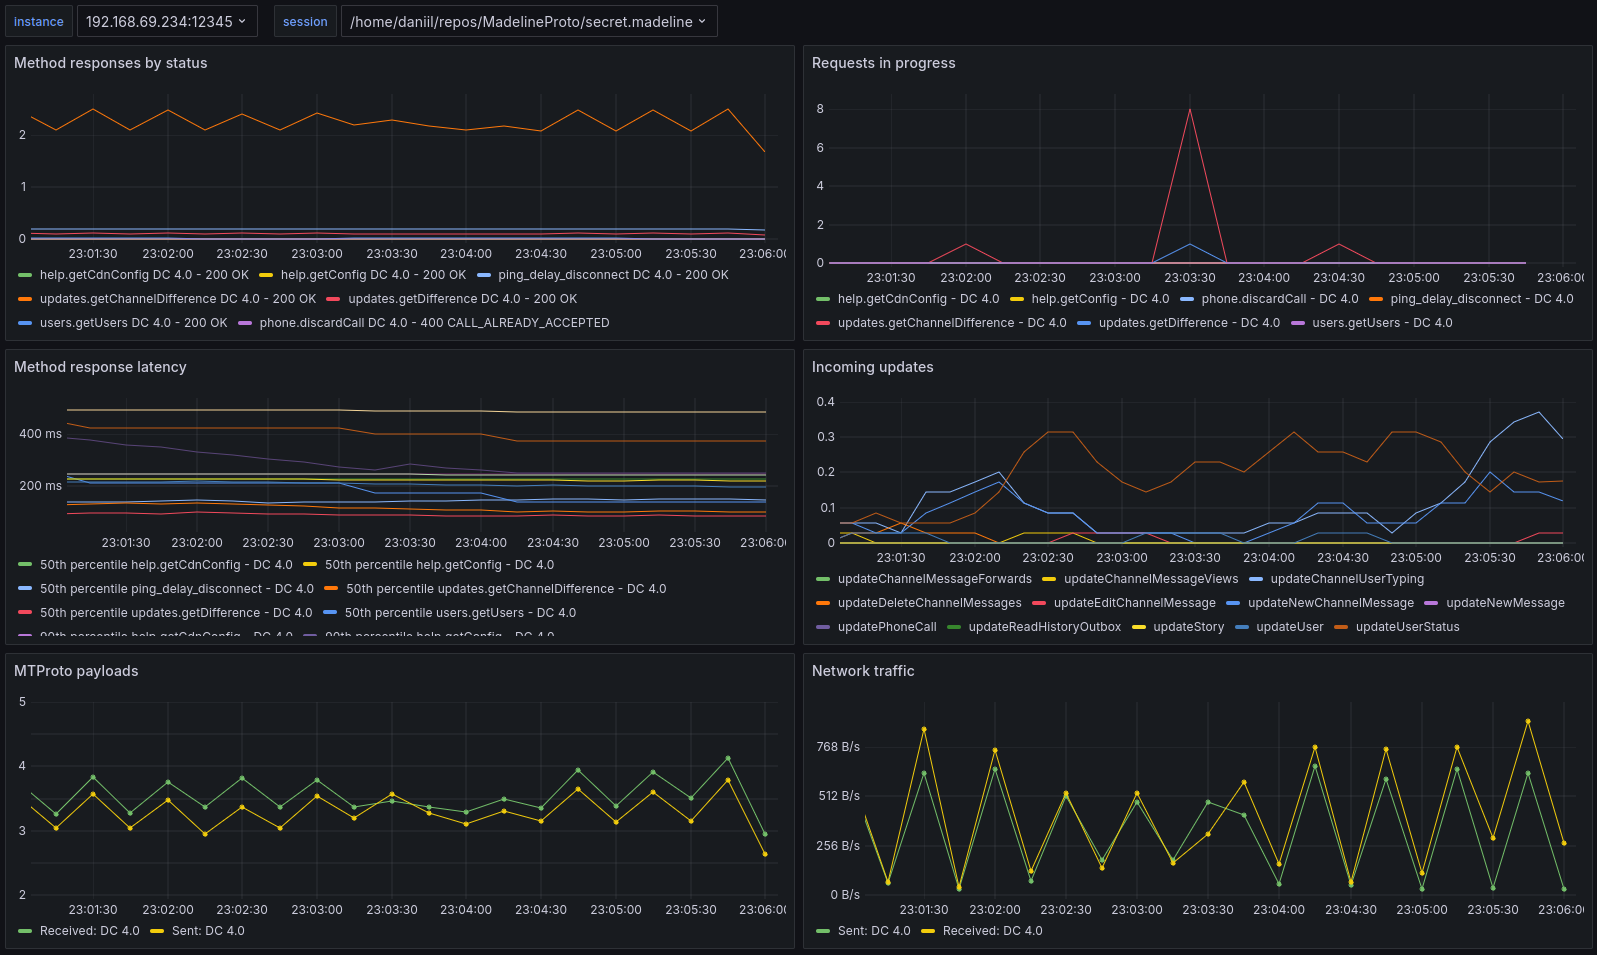
MadelineProto can expose many useful metrics, that can be visualized using the official MadelineProto Grafana dashboard.
Getting started
To get started, enable Prometheus stat collection in the MadelineProto settings:
use function Amp\Socket\SocketAddress\fromString;

$settings->getMetrics()->setEnablePrometheusCollection(true);

// You can also enable collection of additional memory profiling metrics.
// Note: you must also set the MEMPROF_PROFILE=1 environment variable or GET parameter.
// $settings->getMetrics()->setEnableMemprofCollection(true);

// Metrics can be returned by an autoconfigured http://127.0.0.1:12345 HTTP server.
//
// Endpoints:
//
// /metrics - Prometheus metrics
// /debug/pprof - PProf memory profile for pyroscope
//
$settings->getMetrics()->setMetricsBindTo(fromString("127.0.0.1:12345"));

// Metrics can also be returned by the current script via web, if called with a specific query string:
//
// ?metrics - Prometheus metrics
// ?pprof - PProf memory profile for pyroscope
//
// $settings->getMetrics()->setReturnMetricsFromStartAndLoop(true);

MyEventHandler::startAndLoop('bot.madeline', $settings);
This will expose Prometheus metrics on 127.0.0.1:12345/metrics (if setMetricsBindTo is used) or https://example.com/bot.php?metrics (if setReturnMetricsFromStartAndLoop is used).
Configuring Grafana
The easiest way to get started using Prometheus and visualizing data via Grafana is by creating a free account on grafana.com and using the hosted Grafana instance.
During this process, you’ll install the Grafana agent, which will read the metrics either on either 127.0.0.1:12345/metrics or https://example.com/bot.php?metrics, and push them to Grafana.com.
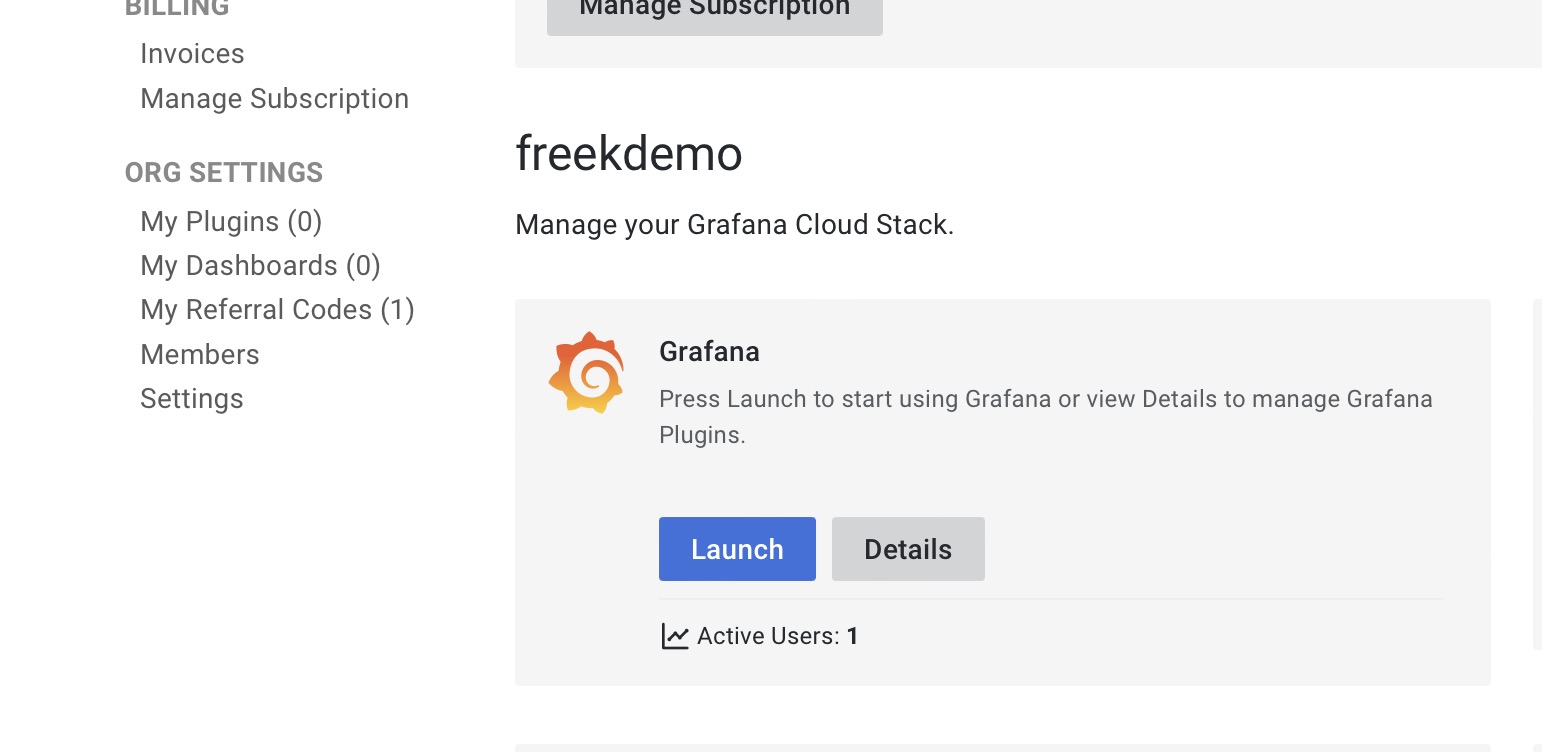
Once your account has been created, you’ll be on your account dashboard. There, you should launch your Grafana instance by clicking the “Launch” button.
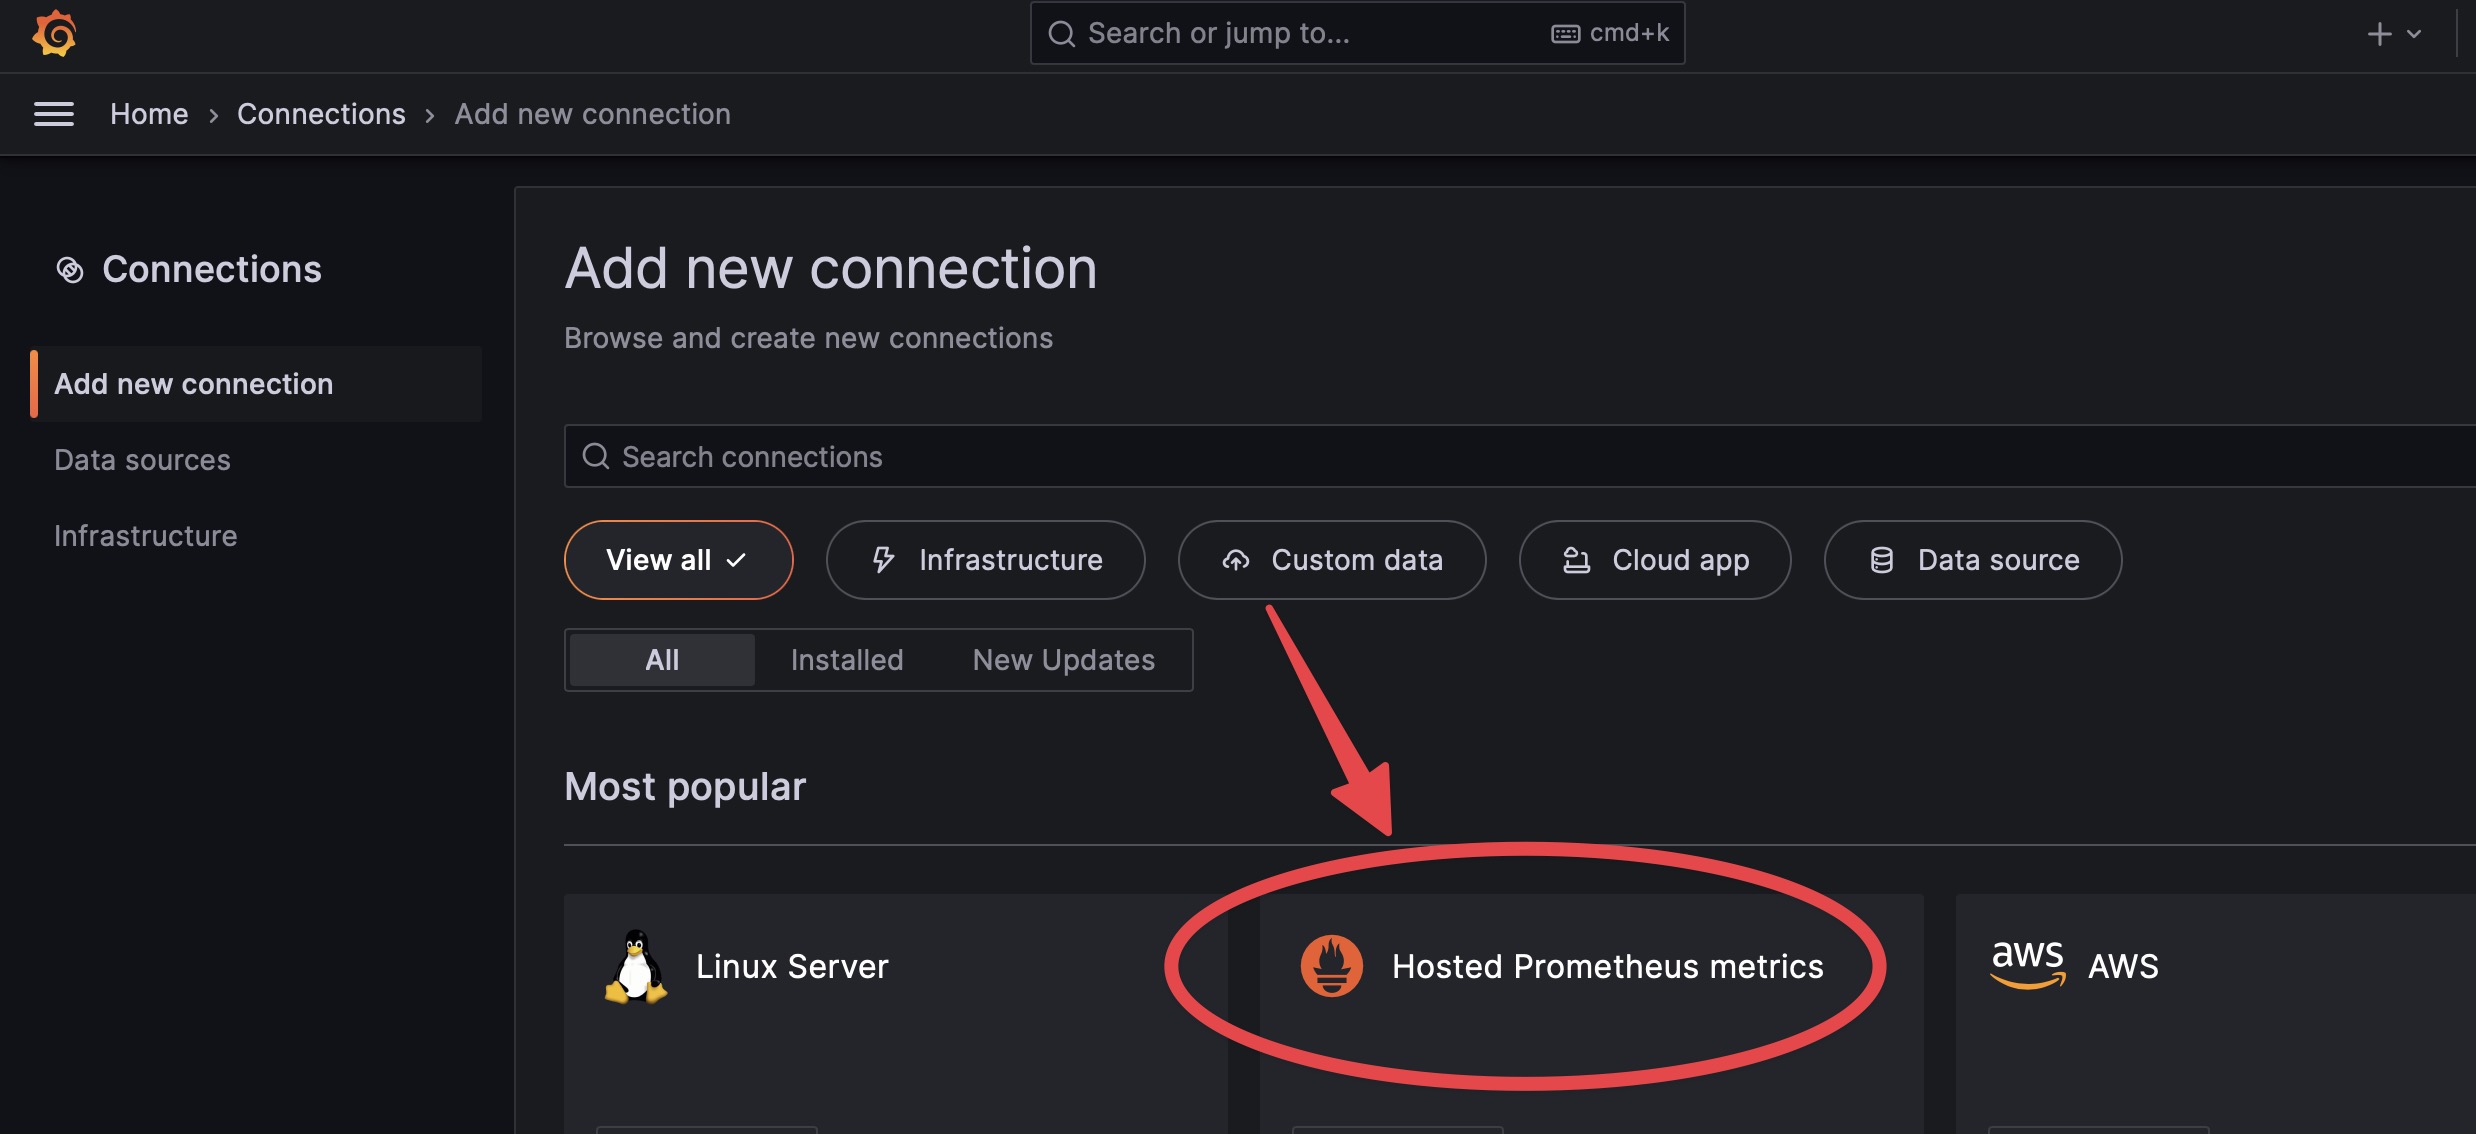
At this point, you’ll be redirected to your Grafana instance. There, you must go to “Connections” and add a new connection of type “Hosted prometheus Metrics”.
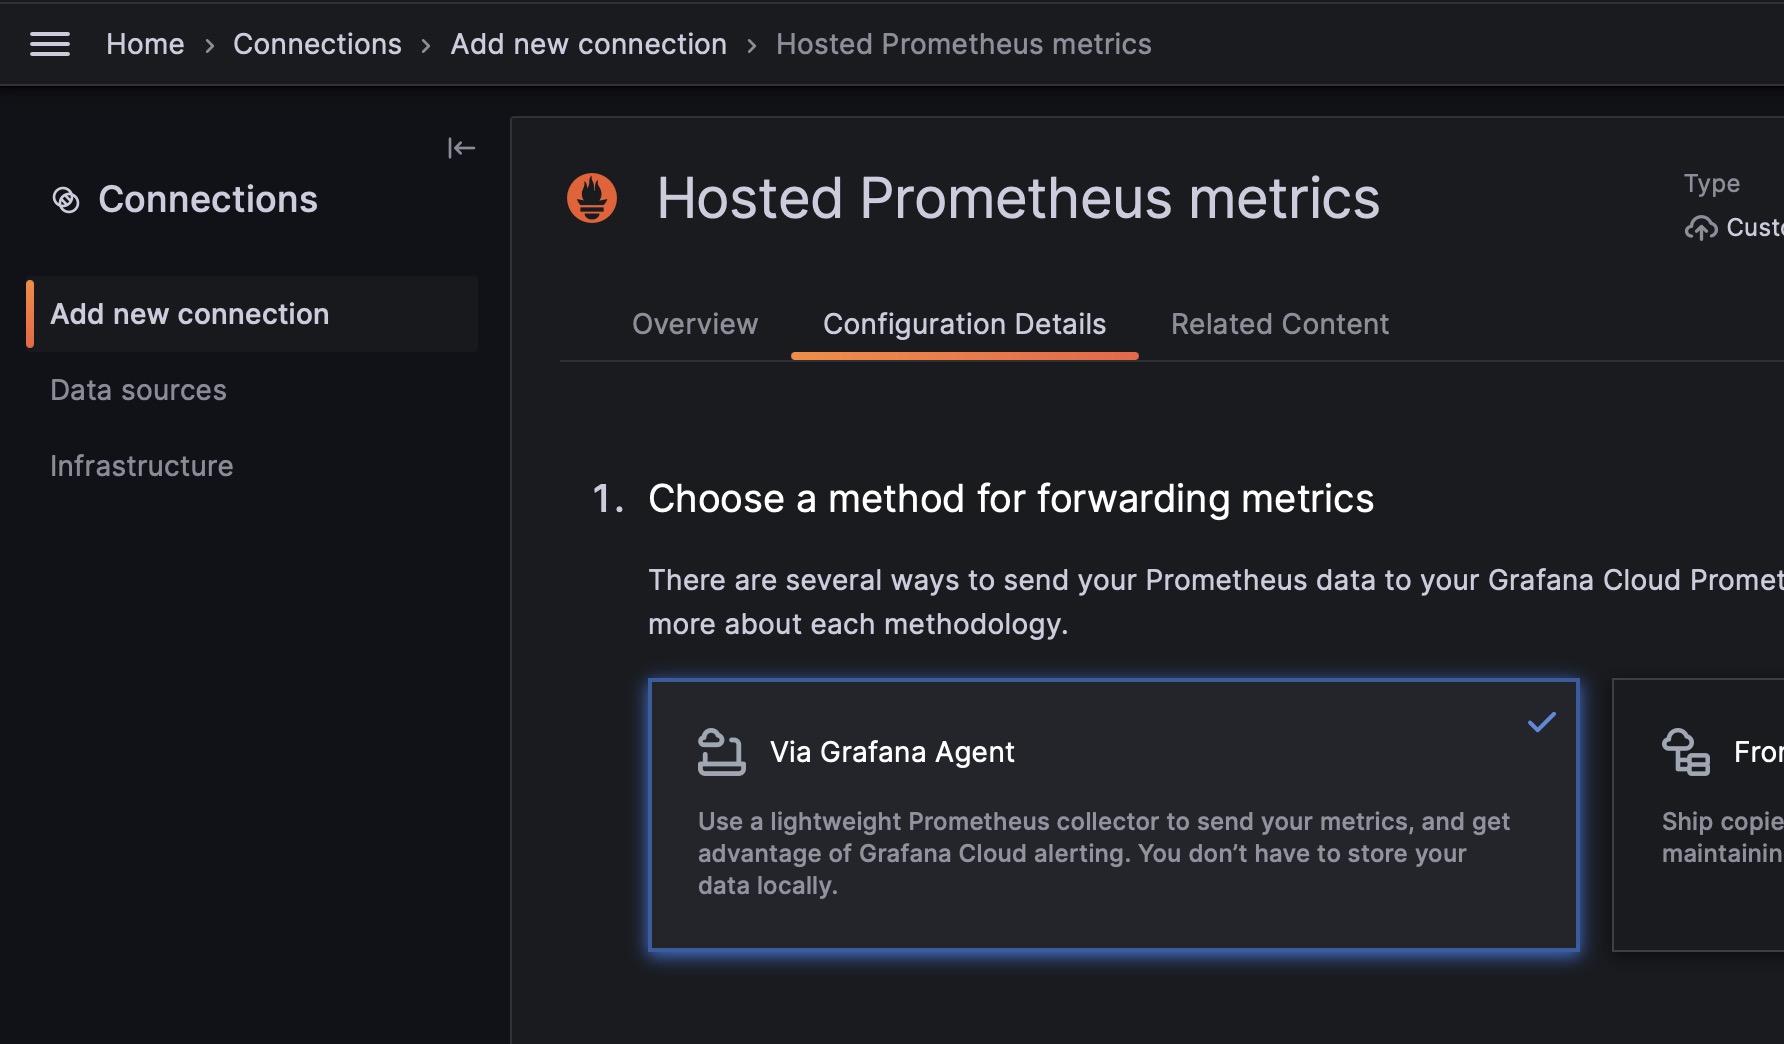
When creating a new connection, choose “Via Grafana Agent”.
 .
.
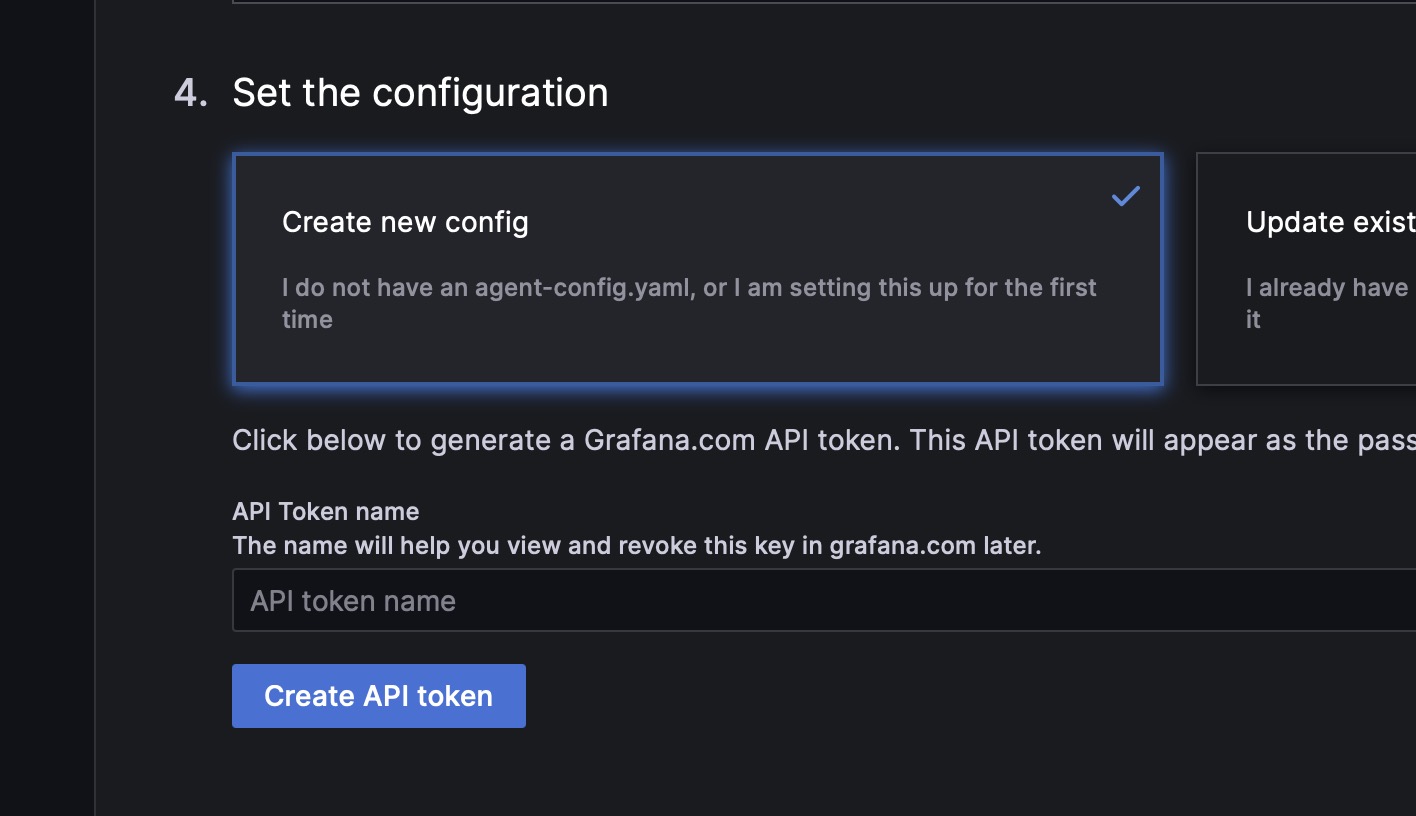
Next, follow the wizard, install the agent, and create a new config.
 .
.
Follow, the steps to create the config file, and start the agent on your server.
In the scrape_configs key of the config, you should add a job to scrape the /metrics endpoint of your Laravel application. For example:
  global:
      scrape_interval: 10s
  configs:
      - name: hosted-prometheus
        scrape_configs:
            - job_name: MadelineProto
              scrape_interval: 10s
              metrics_path: /metrics
              # metrics_path: /bot.php?metrics
              static_configs:
                  - targets:
                    - '127.0.0.1'
                    # - 'example.com'
        remote_write:
            - url: <filled in by the wizard>
              basic_auth:
                  username: <filled in by the wizard>
                  password: <filled in by the wizard>
Creating a dashboard
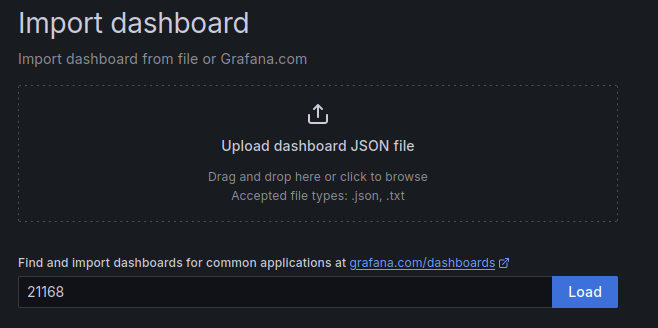
Once you’ve configured the agent, you can create a new dashboard. Head over to “Dashboards”, click on “+” and “Import dashboard”.
On the import screen, insert the ID of the MadelineProto dashboard, 21168.
Next, click your hosted prometheus instance as the source.
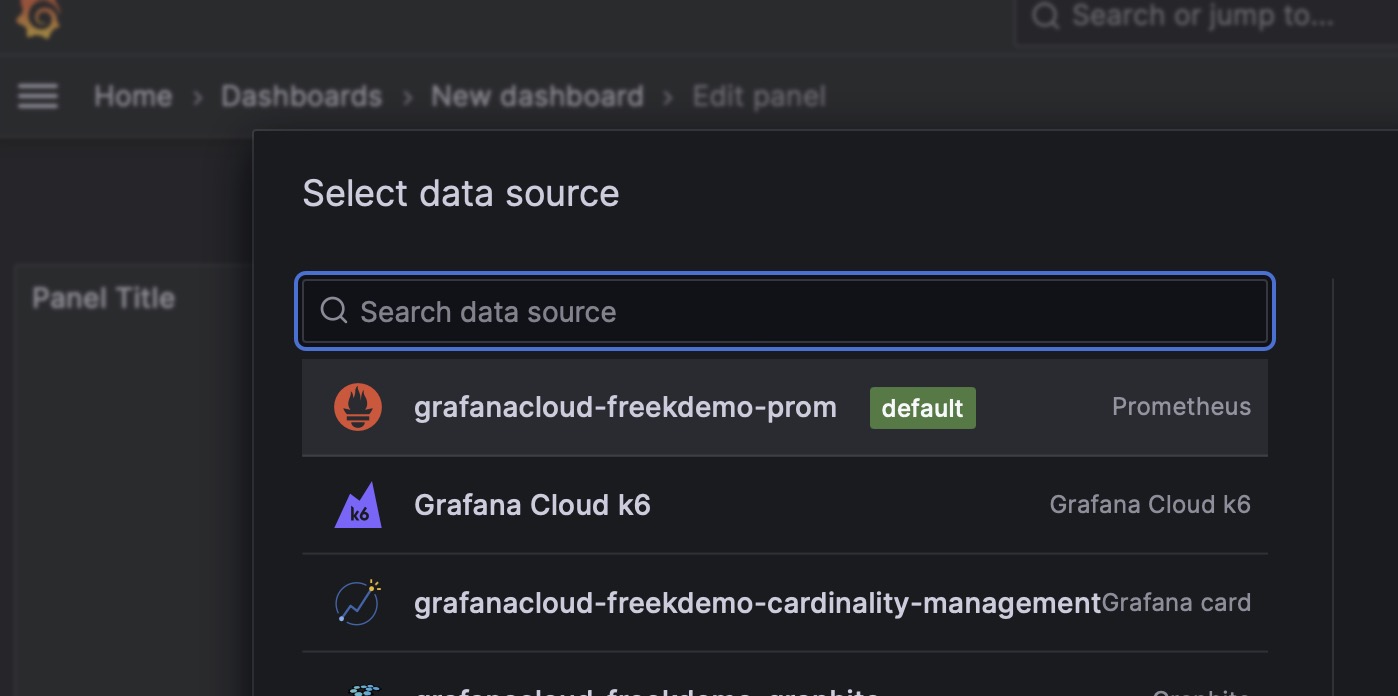
And you’re done!
Enjoy detailed MadelineProto metrics, powered by MadelineProto & Grafana!